Are you Putting Off Water Submetering?
Articles
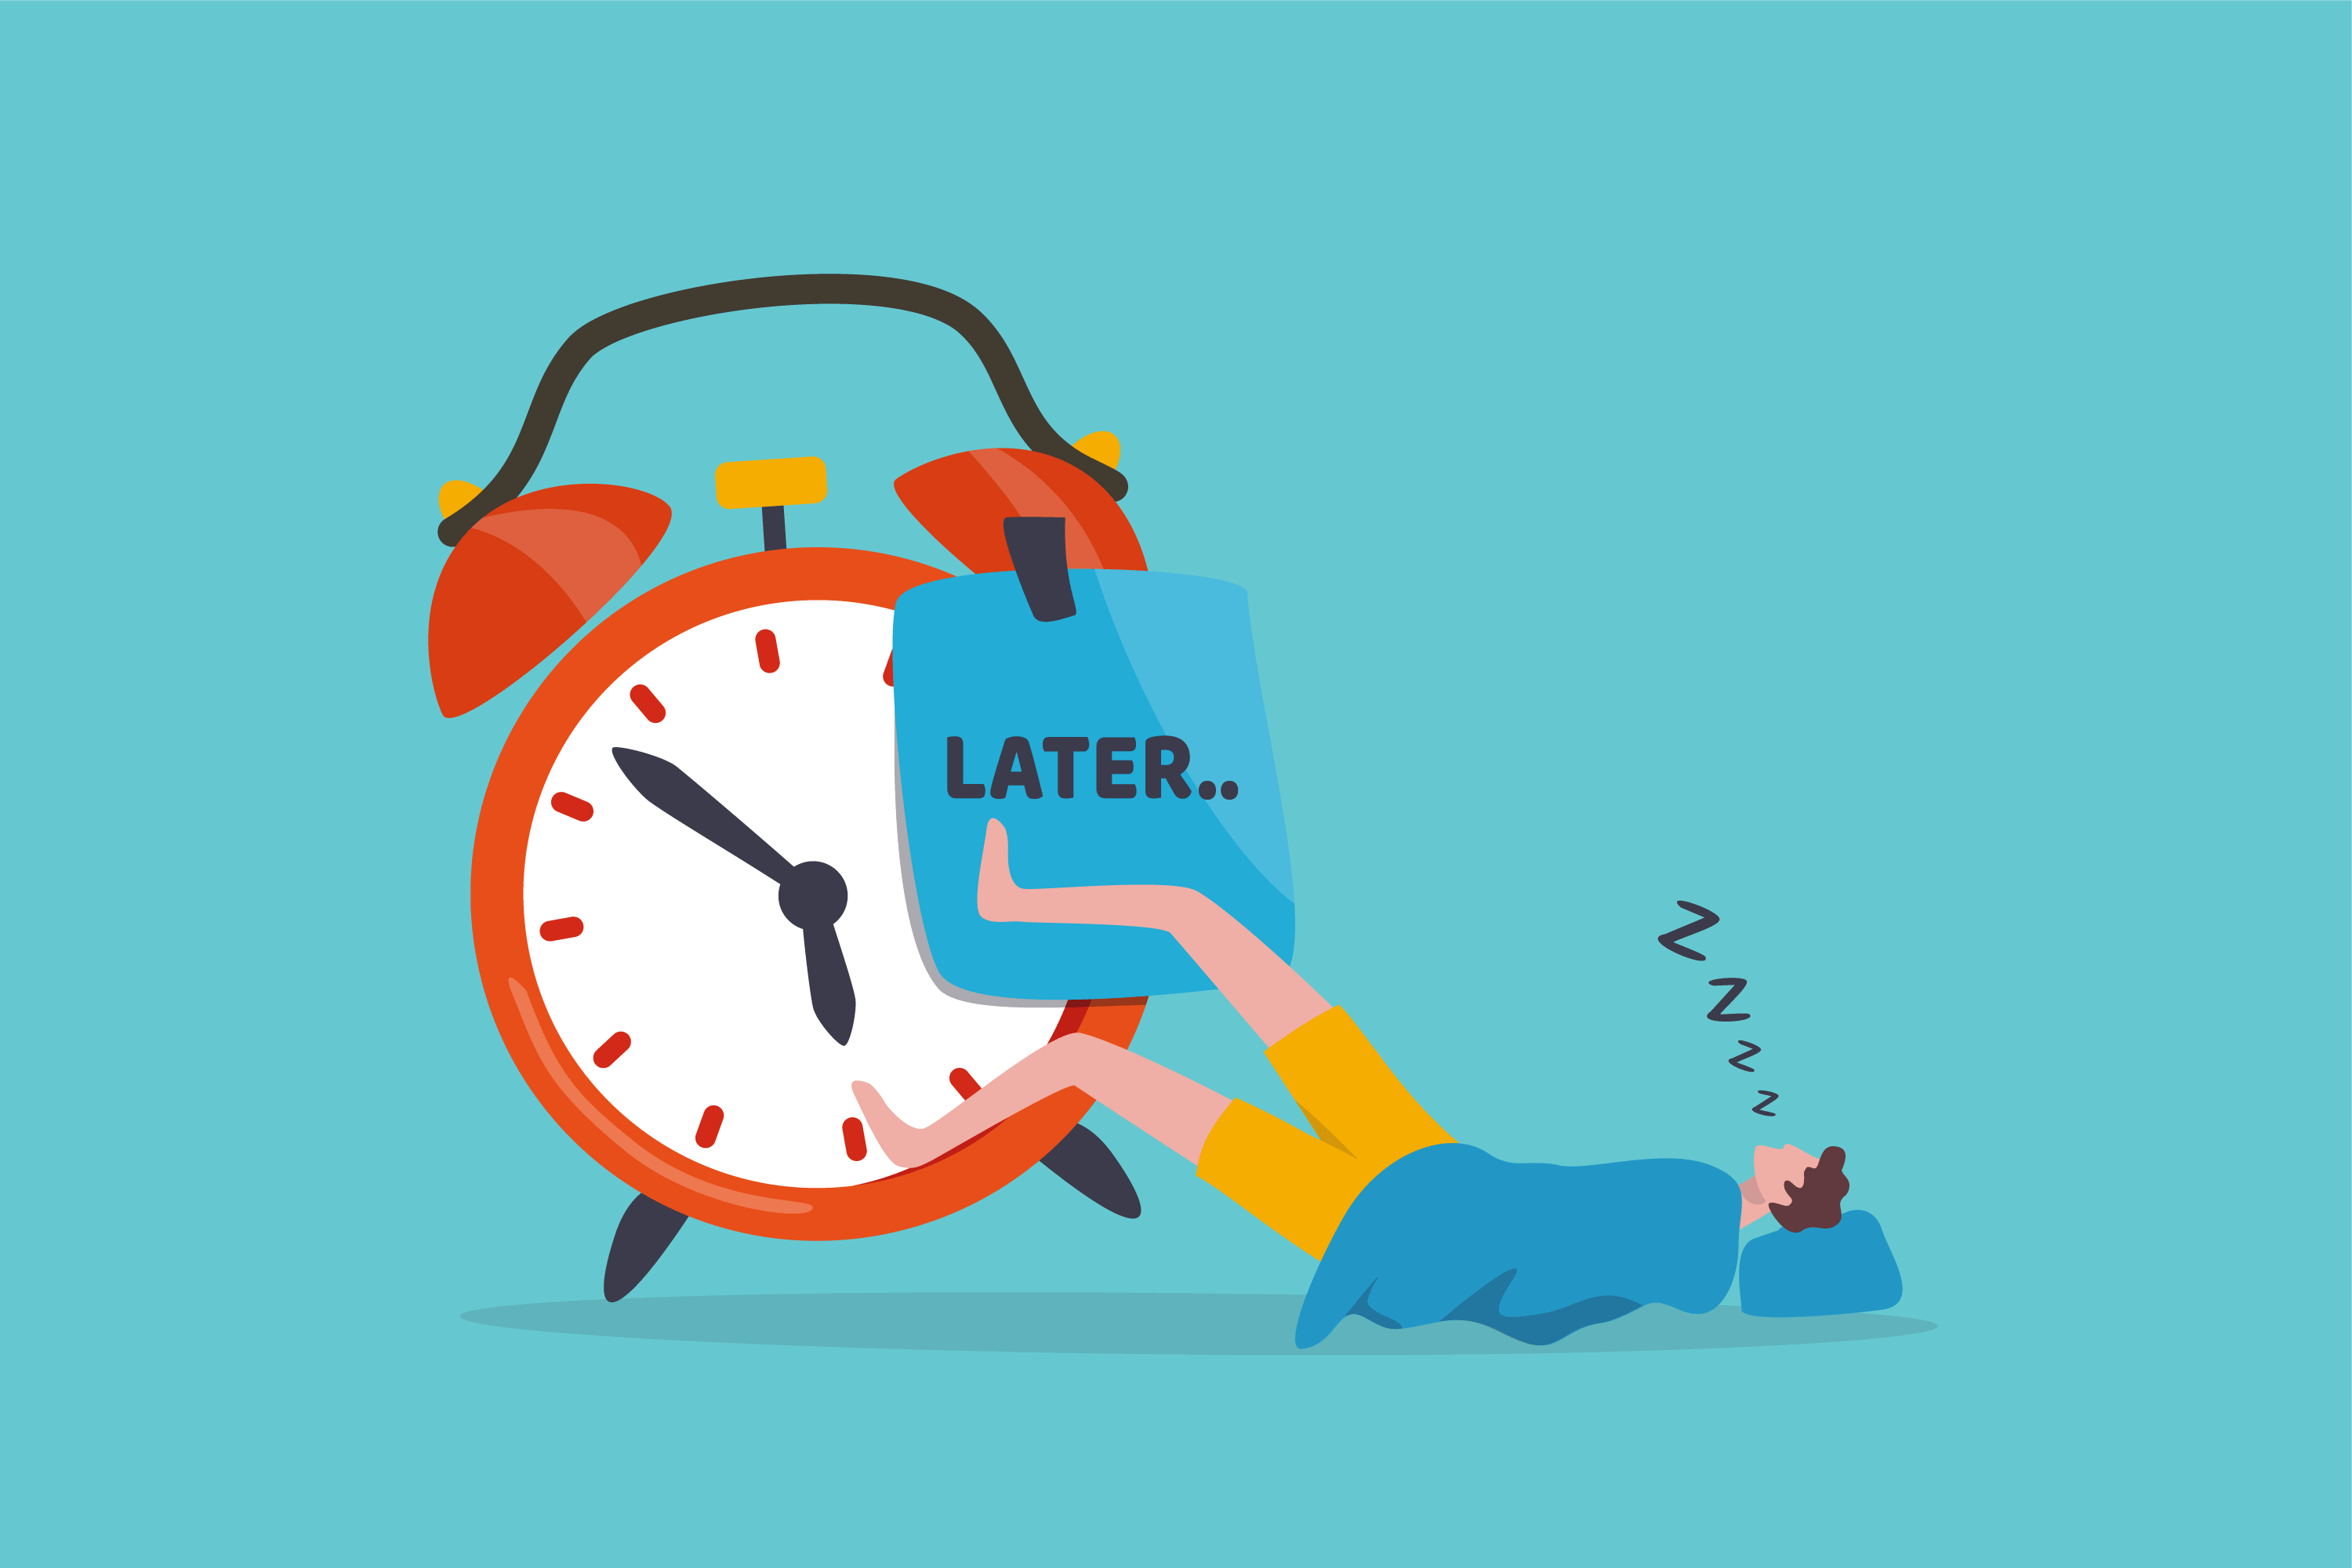


Why do some property owners procrastinate submetering water?
If you own or operate multifamily or HOA properties, you’re probably not avoiding submetering because you don’t believe in it. You’re pushing it off because it feels like one more project in a world already full of turns, rehabs, refis, and fire drills.
It looks like a capital line item you can safely defer: new hardware, install coordination, lease updates, resident communications, another platform for the team to adopt. On paper, “do nothing (for now)” feels like the safe, cheap choice. No invoices. No disruption. No internal change-management.
But that logic ignores the fact that you’re already paying a water tax for indecision, in the form of overuse, leaks, and rising rates.
Every month you delay, you’re still buying water that no one is accountable for and absorbing leaks that only show up when the bill spikes or the drywall fails. Inaction is not neutral; it’s a decision to keep funding inefficiency with operating dollars.
The real trade-off usually isn’t “spend money vs. save money”—it’s “spend once on a submetering project vs. keep spending every month on avoidable waste.”
Most SimpleSUB Water customers see a full ROI in less than a year, often sooner when early leak detection prevents a major bill or damage event. After that, the savings and recovered costs compound while water rates continue to climb.
So if submetering has been sitting on the “someday” list, it’s worth asking:
"How much is 'someday' actually costing you?"
How to Quantify the Cost of Waiting to Add Water Submeters
If you own or operate multifamily or HOA properties, you’re probably already convinced that submetering is a good idea. The real question is: how expensive is it to wait?

Here’s the fastest way to frame it:
- Start with your annual water + sewer spend. Use the last 12 months of bills for a given property.
- Add 15–20% for behavioral waste and unrecovered usage. That’s the “people use more when it feels free” effect in non-submetered buildings.
- Add 5–10% for leaks. Toilets, slab/line leaks, irrigation, fixtures that run for months before anyone notices.
- Assume water/sewer rates rise ~4–8% per year. Project your waste forward 3–5 years with that escalation.
- Compare that 3 year “do nothing” cost to a submetering project. If the modeled loss is in the same ballpark or higher than the project cost, waiting is the more expensive option.
The math is pretty easy. But the important part is the assumptions. Here’s how we came up with them, and why they’re actually conservative.
Why We Use 15–20% for Behavioral Waste
Non-submetered buildings almost always run “hot” on water use compared to similar properties with unit-level billing. Once residents see—and pay for—their own usage, consumption drops. That’s been measured repeatedly.
A few anchors:
- A national study cited by the EPA found that residents in submetered multifamily units used about 15% less water than residents in unmetered units. (epa.gov)
- SimpleSUB’s own Ultimate Guide to Water Submetering summarizes a two-year EPA study showing 15.3% savings (21.8 gal/day/unit) after submetering in multifamily. (SimpleSUB Water)
- Industry sources and submetering providers generally quote 15–30% reductions in water use after converting from “water included” to unit-level billing. (americansubmetering.com)
If you’re not submetered today, it’s reasonable to assume 15–30% of your current usage is behavioral waste and unrecovered tenant consumption.
For the Cost of Waiting model, we deliberately take the low end of that range:
15–20% of annual water spend = behavioral waste + unrecovered usage
for a typical non-submetered multifamily/HOA property.
For older assets, “all utilities included” properties, or portfolios with high usage per occupied unit, the real number may skew higher—but 15–20% keeps the math defensible in conversations with asset managers, partners, and lenders.
If someone wants a primer on how submetering drives those behavior changes, you can point them to Water Submetering 101. (SimpleSUB Water)
Why We Assume 5–10% for Leaks
Behavioral waste is only half the story. The other half is leaks:
- Silent toilet flappers that run for months
- Slab and line leaks that never show up in a unit
- Dripping fixtures and irrigation issues no one reports
The EPA’s WaterSense program and partner utilities estimate that:
- Fixing “easily corrected” leaks can save the average household about 10% on its water bill. (epa.gov)
- Typical homes waste around 10,000 gallons of water per year from leaks, and about 10% of homes have leaks wasting 90+ gallons per day. (Eco Actions)
Those numbers are for single homes. In a stacked multifamily building with dozens or hundreds of fixtures, it’s easy for leak-driven waste to hit or exceed that ~10% of the bill—especially when you only see a single master meter and rely on residents to call in issues.
Because we’re building a simple, broadly applicable model, we treat 5–10% of total spend as leak waste in a non-submetered property:
5–10% of annual water spend = leak waste
from toilets, fixtures, lines, and irrigation you can’t see until the damage is done.
In practice, once owners add unit-level monitoring and real-time leak alerts through platforms like SimpleSUB Water, a surprising amount of savings comes from catching exactly these “small, constant” leaks early. (SimpleSUB Water)
Why We Model 4–8% Annual Water & Sewer Rate Growth
Even if your usage stayed flat, your cost per gallon won’t.
Bluefield Research’s analysis of U.S. water and sewer rates across major cities shows that:
- Combined water + sewer bills for a typical household have increased about 24% in five years, roughly 4–5% per year on average. (Bluefield Research)
- The 2023–2024 increase alone was 4.6% year over year, and utilities face ongoing pressure from aging infrastructure, PFAS and other water-quality investments, and climate impacts. (Bluefield Research)
Most owners are seeing the same pattern locally: mid-single-digit annual increases in base charges and volumetric rates, with occasional step changes when utilities do multi-year capital catch-ups.
So in the Cost of Waiting framework, we assume:
4–8% annual escalation on your waste number,
depending on how aggressive your local utility has been.
4–5% matches national averages. 6–8% is a realistic stress test for many fast-growing or infrastructure-constrained regions.
Putting the Assumptions Together
At this point, the structure is straightforward:
- Behavioral waste: 15–20%
- Leak waste: 5–10%
- Total waste: 20–30% of your annual water spend
- Rate growth: 4–8% per year
So if a property spends $100,000/year on water + sewer:
- Low scenario (20% waste) → $20,000/year burned
- High scenario (30% waste) → $30,000/year burned
Apply ~5% annual rate growth, project over 3–5 years, and the “do nothing” path can easily represent $60k–$150k in cumulative, avoidable spend—before you count staff time on billing disputes or the NOI/valuation impact of lower operating costs.
You don’t need a complex model to see the shape of that curve. Your accounting system already has the inputs.
How SimpleSUB Reduces the “Cost of Doing Something New”
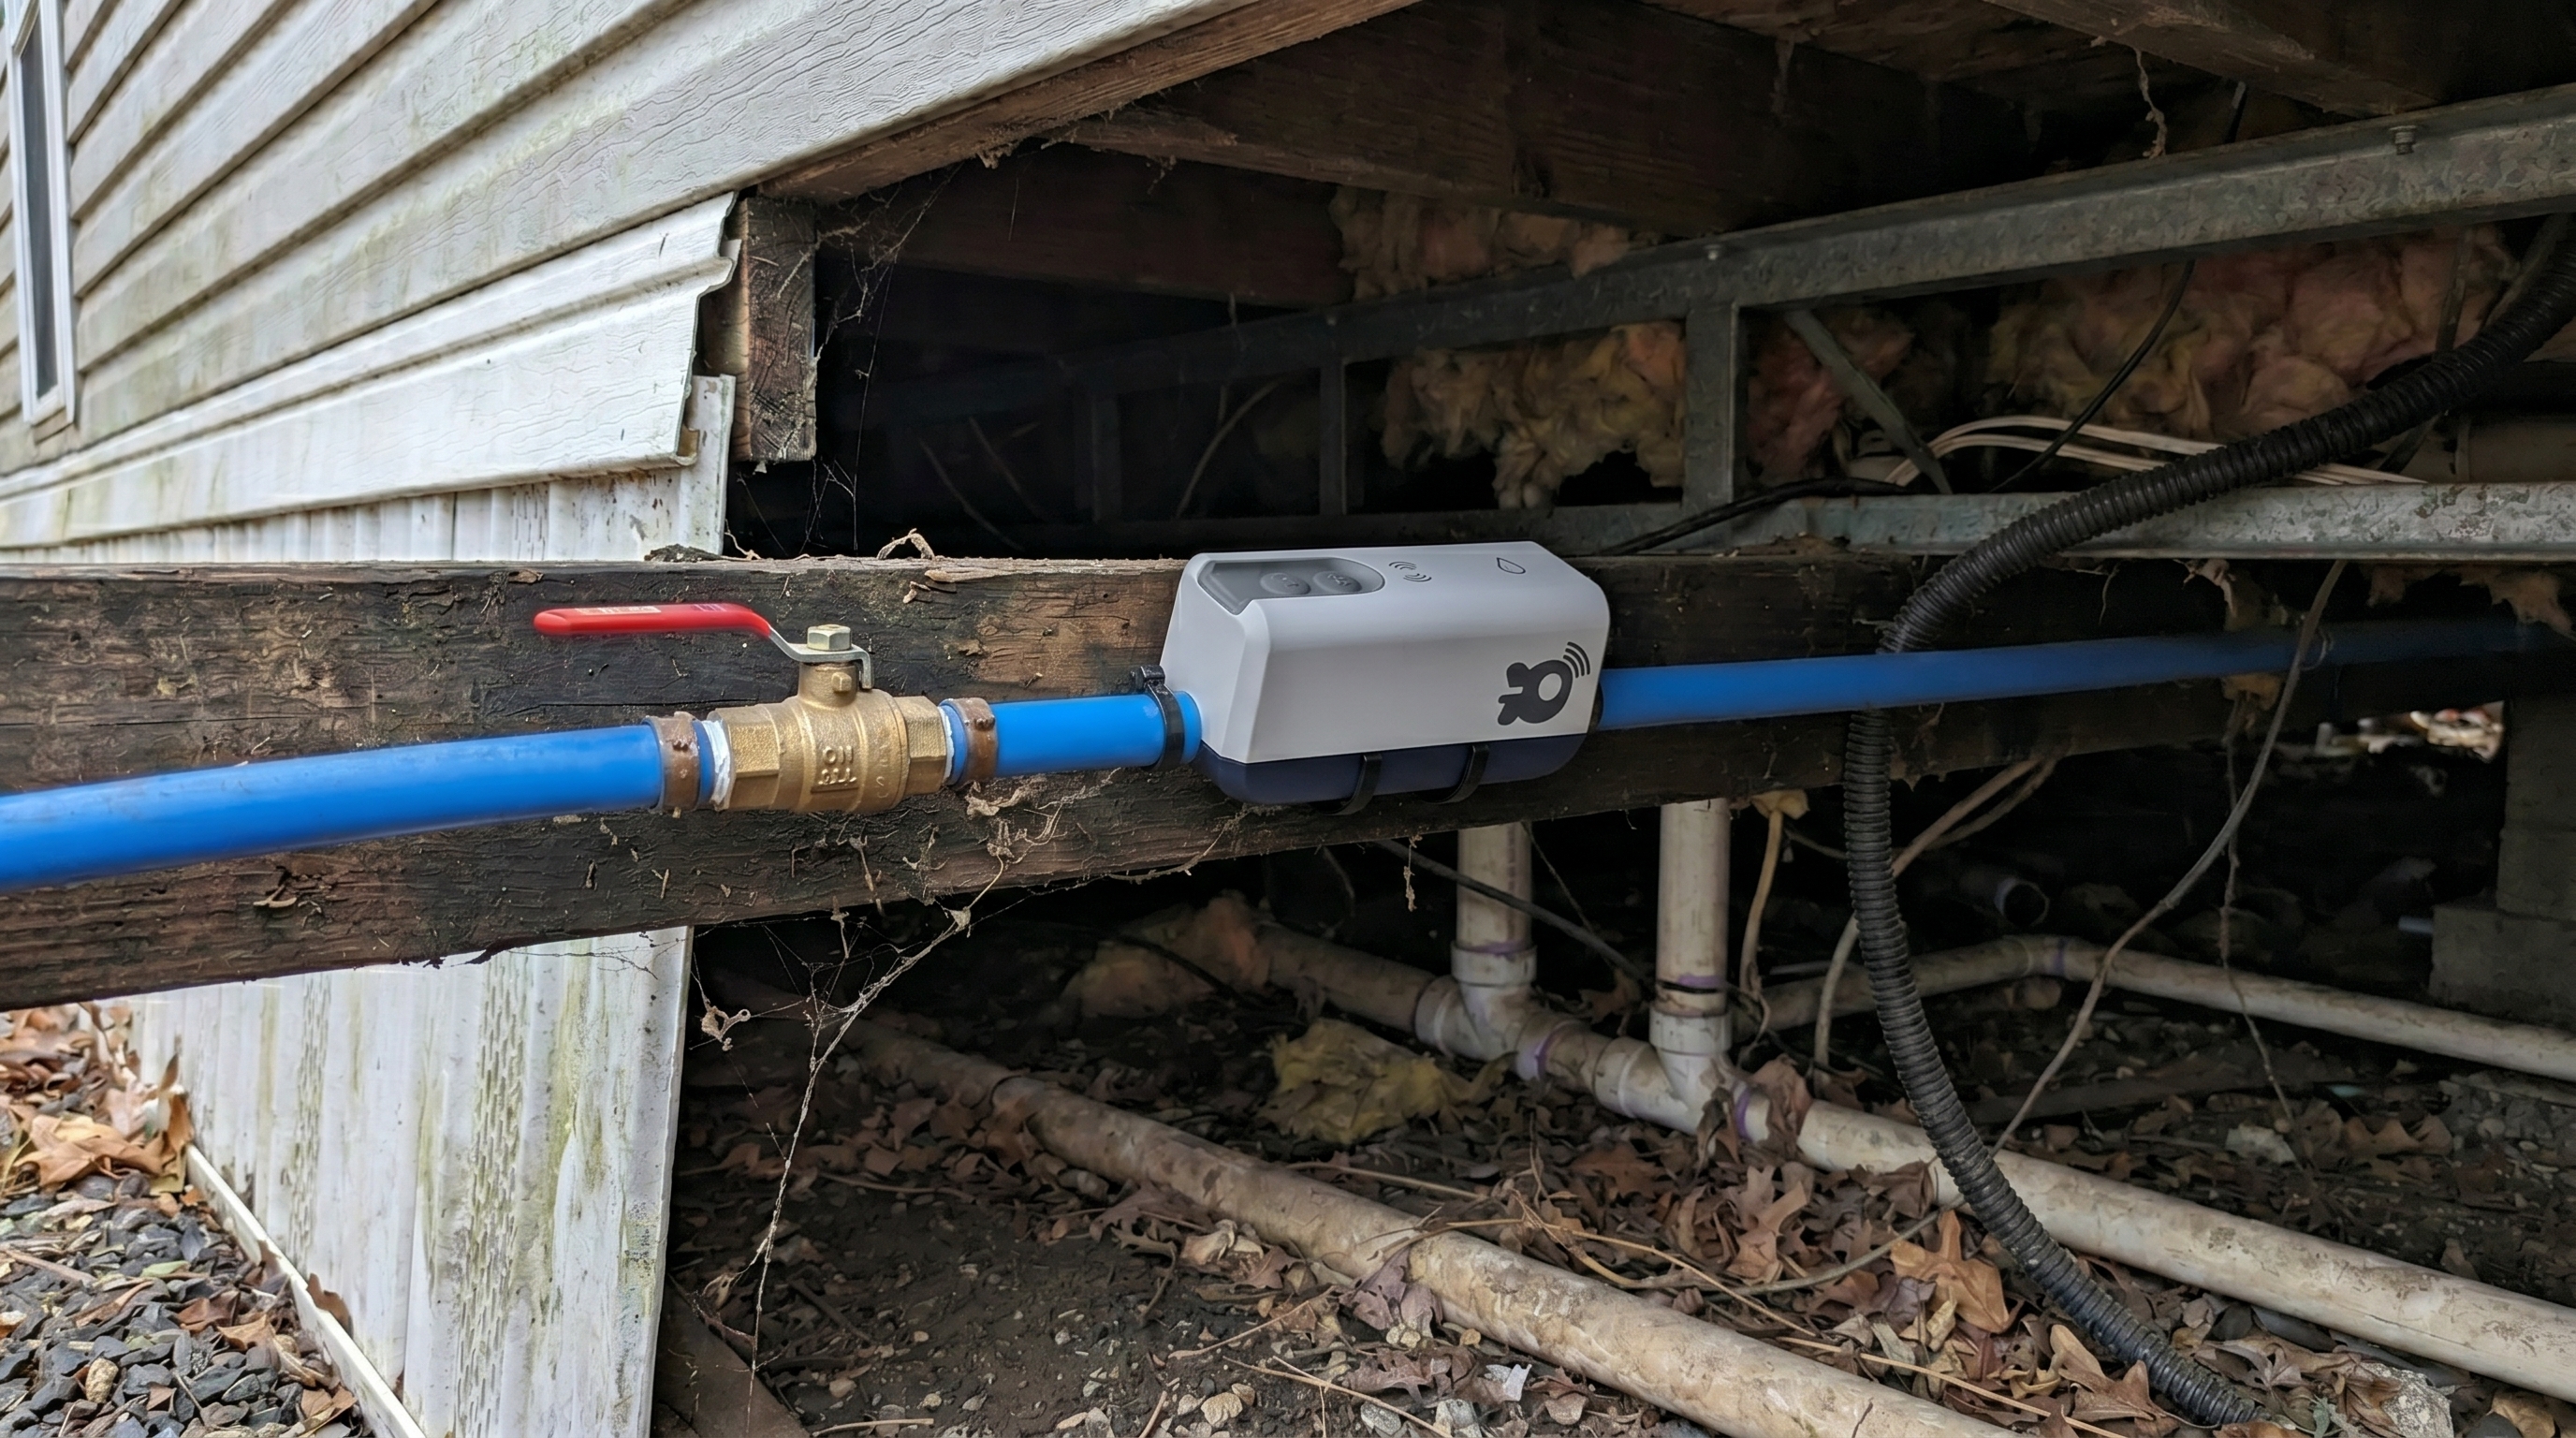
If the only thing keeping submetering on the “later” list is the perceived hassle, that’s exactly what SimpleSUB Water was built to attack:
- Over-the-pipe, clamp-on meters install without cutting into plumbing or opening walls. (See How it Works)
- Built-in cellular connectivity means no building Wi-Fi, gateways, or repeaters to worry about. (SimpleSUB Water)
- Industry-leading accuracy (100% ±5%) makes the data billing-grade. (See just how accurate it is)
- Automatic Pipe Detection (APD) (SimpleSUB’s proprietary feature) helps ensure meters are installed on the correct live lines, reducing install errors and getting you to reliable data faster.
That combination is why most SimpleSUB customers see payback in roughly 12–18 months, sometimes much faster when the system catches a significant leak early. After that, the math flips: every quarter you wait is no longer “saving capex”—it’s extending the life of a waste stream you now know how to quantify.
If submetering has been on your list for a while, this is the moment to run the numbers with your actual annual spend. Once you’ve seen your own Cost of Waiting, “someday” gets a lot harder to justify.
Schedule a demo today.
Disclaimer: SimpleSUB’s water submetering and billing features may not be permitted in all states or local jurisdictions. You are solely responsible for ensuring that your use of any billing or cost-recovery tools complies with all applicable laws and regulations in your area. Nothing on this page (or elsewhere on our site) should be considered legal advice. You should consult your own legal counsel before implementing any billing practices.
Request a Demo
We’ll design an affordable, easy-to-install solution for your submetering project, large or small.
Read Related Articles

Ultimate Guide
Articles
Articles

